Introduction
In the previous tutorial, we learned how to interface the serial monitor of Arduino to a Python program. In this tutorial, we will learn to store this data in a CSV file for post-processing. This is a useful technique because if you have well-formatted data in CSV, you can plot this as a graph or even use this data to train a machine learning algorithm.
CSV stands for “Comma Separated Values”. It is called so because its data fields are often separated by a comma. CSV files can be created even with the notepad app or simple text editors.
Circuit Diagram
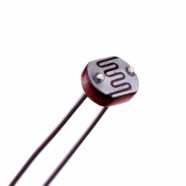
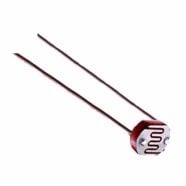
For this tutorial, we will use the circuit below. We will create a voltage divider circuit using a 100k resistor and an LDR then take the analog input from their middle node.

Arduino Code
					void setup(){
  pinMode(A0, INPUT);
  Serial.begin(115200);
}
void loop(){
  Serial.println(analogRead(A0));
  delay(6000);
}
This code keeps sending the sensor values to the serial port every 6 seconds.
Now, let’s implement a Python program to capture this data in a graph.
Python
Downloading Thonny IDE makes Python programming easier for beginners. Go to https://thonny.org/ to download and install Thonny IDE.
For this project, we will use 3 Python modules, namely:
- time
- csv
- pyserial
Time and csv are taken from Python’s built-in libraries. Thonny may have Pyserial already installed as a plug-in. To check this, go to Tools->Manage Plug-ins and look for PySerial. If it’s not yet installed, you can search for it in the search bar.

Here is the actual Python code. Note that Python is very sensitive when it comes to using spaces or tabs. With this, you can download the actual code here.
Python Code
					import serial
import time
import csv

with open('SensorData.csv', mode='a') as sensor_file:
    sensor_writer = csv.writer(sensor_file, delimiter=',', quotechar='"', quoting=csv.QUOTE_MINIMAL)
    sensor_writer.writerow(["Value", "Time"])


com = "COM8"
baud = 115200

x = serial.Serial(com, baud, timeout = 0.1)

while x.isOpen() == True:
    data = str(x.readline().decode('utf-8')).rstrip()
    if data is not '':
         print(data)
         with open('SensorData.csv', mode='a') as sensor_file:
             sensor_writer = csv.writer(sensor_file, delimiter=',', quotechar='"', quoting=csv.QUOTE_MINIMAL)
             sensor_writer.writerow([int(data), str(time.asctime())])
Note that the com & baud variables you declared here should match what you have with your Arduino code.
If you execute the code using the play button, you should have an output similar to this:
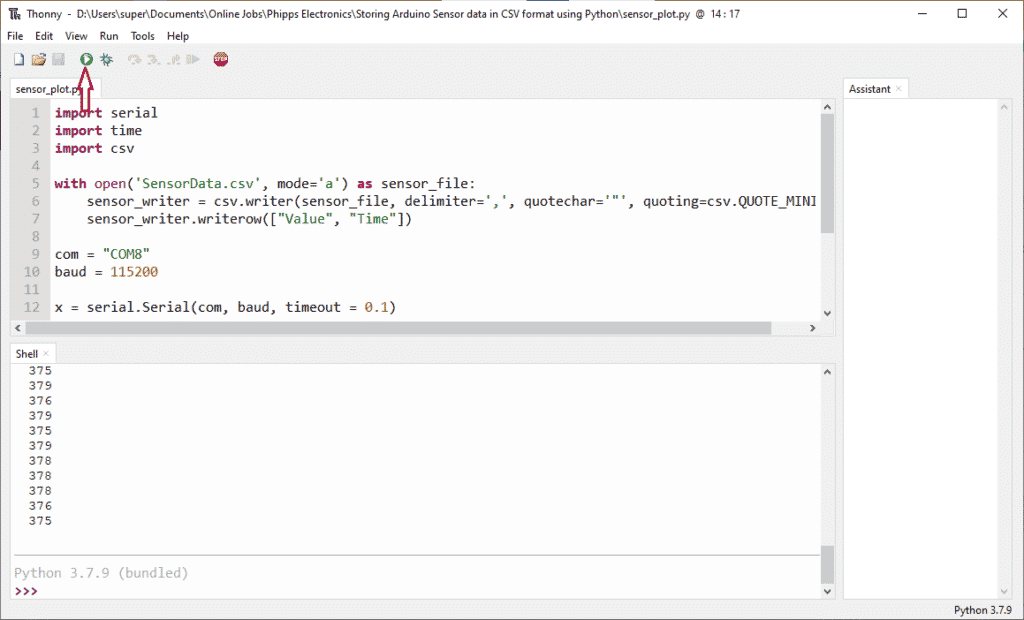
You should see the shell window printing sensor values every 6 seconds. Keep the window open for some time then check your current folder. You should see a new file there named “SensorData.csv” along with your python script file.
Open this file in Excel and you will see your Sensor data values plotted along with their current date and time of acquisition.

The next step is to edit this data in order for it to be represented in graphical form. First, you’ll have to delete all unnecessary spaces. To do that, press F5 > Click “Special” > Select “Empty”.
Now, click

Next, select the 1st column with your sensor values. Then using the insert menu, select your preferred form of a graph. The line or area chart is a good choice to represent the amount of light intensity in your room over an extended period of time.

Conclusion
You can gather sensor data from Arduino that can be interpreted by Python code. The Python code can then transform this data into a CSV file where Excel can interpret it in graphical form.
SHOP THIS PROJECT
-
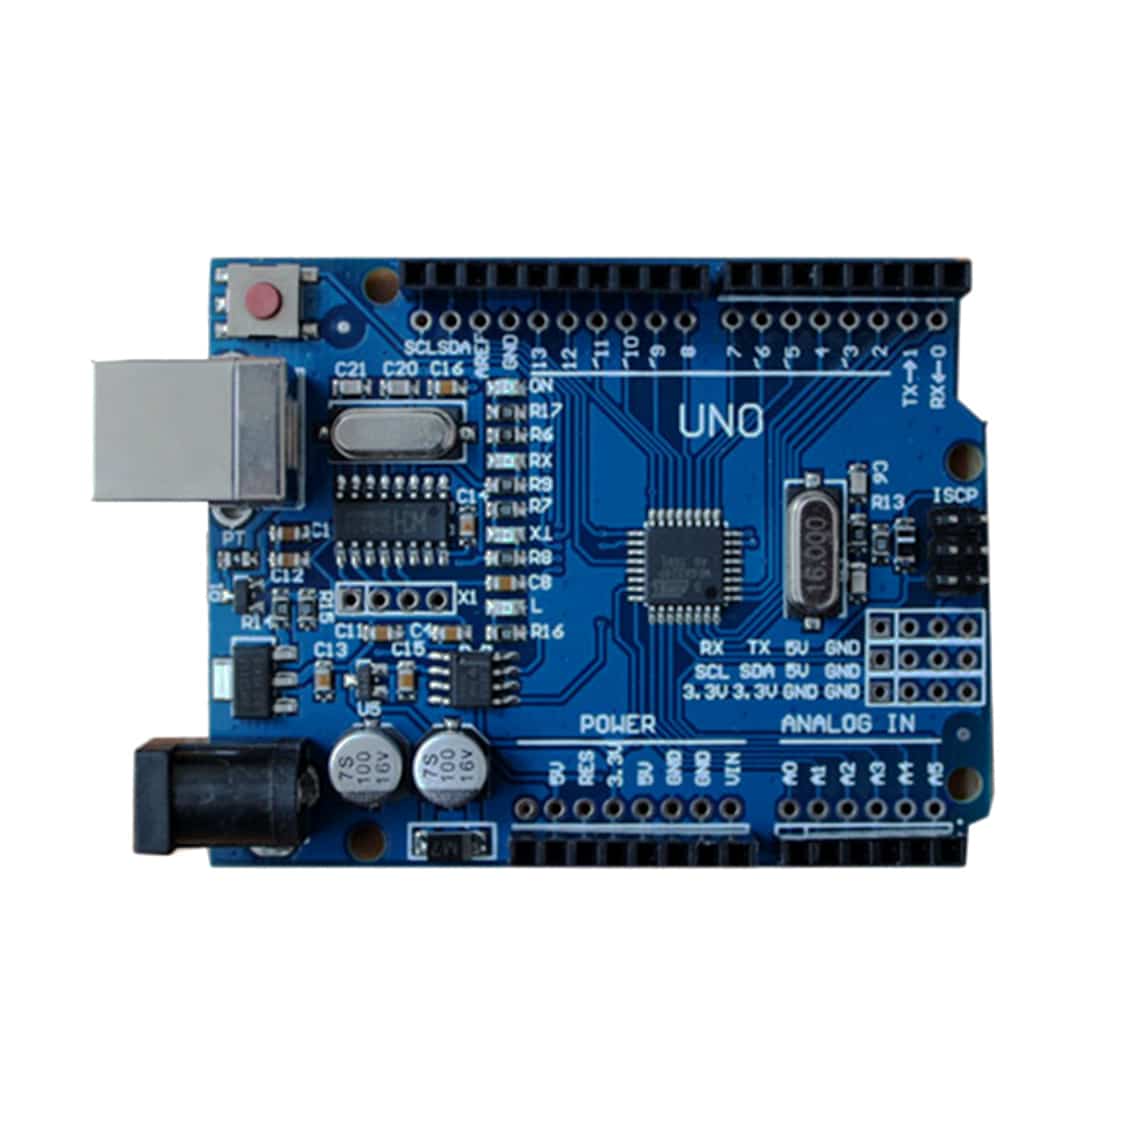
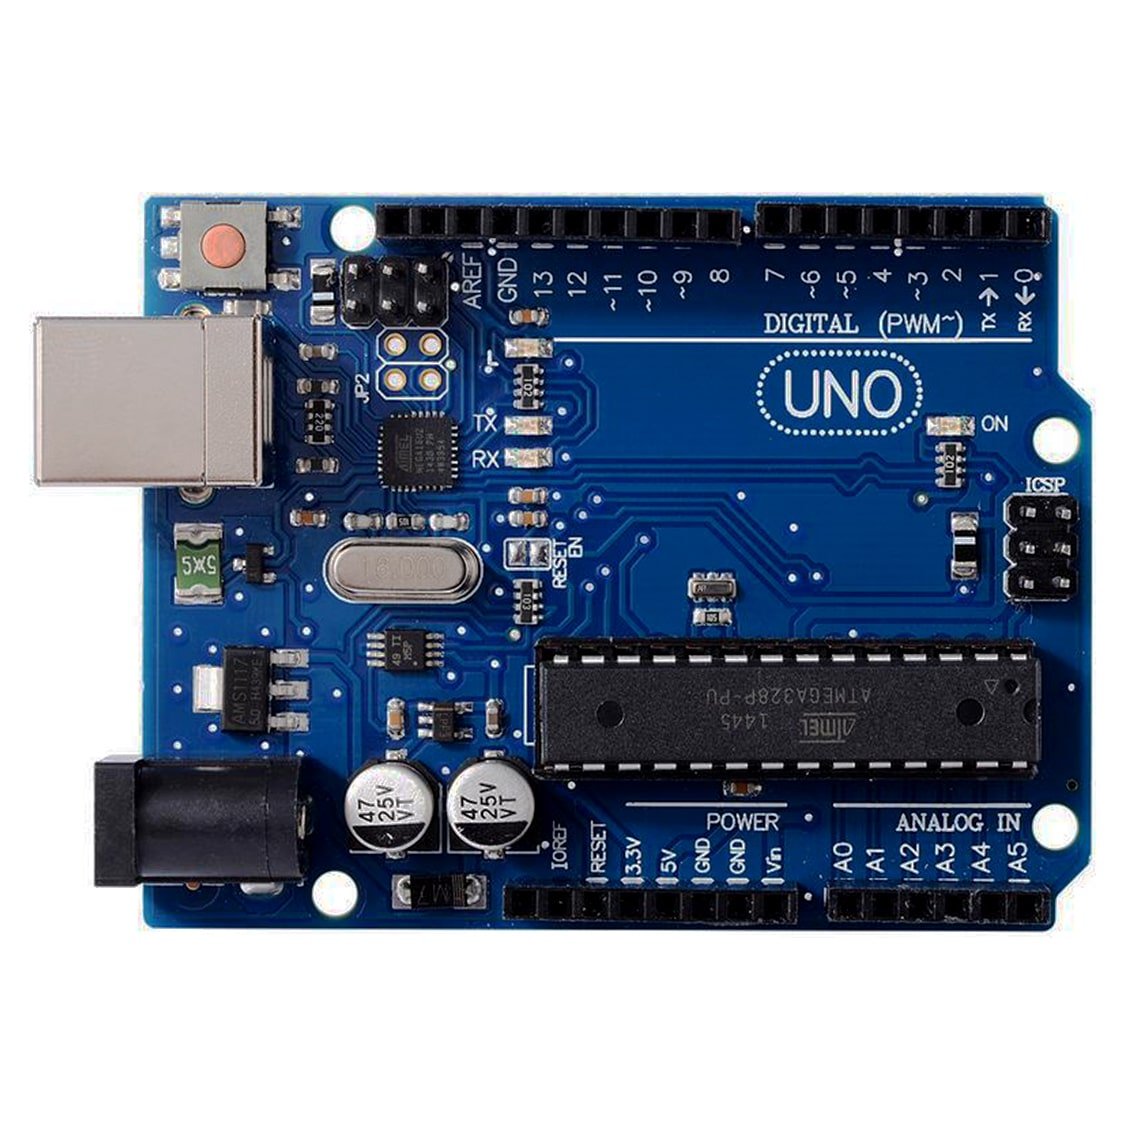
UNO R3 ATmega328P CH340 Development Board – Arduino Compatible with USB Cable
$23.95Original price was: $23.95.$22.95Current price is: $22.95. Add to cart

