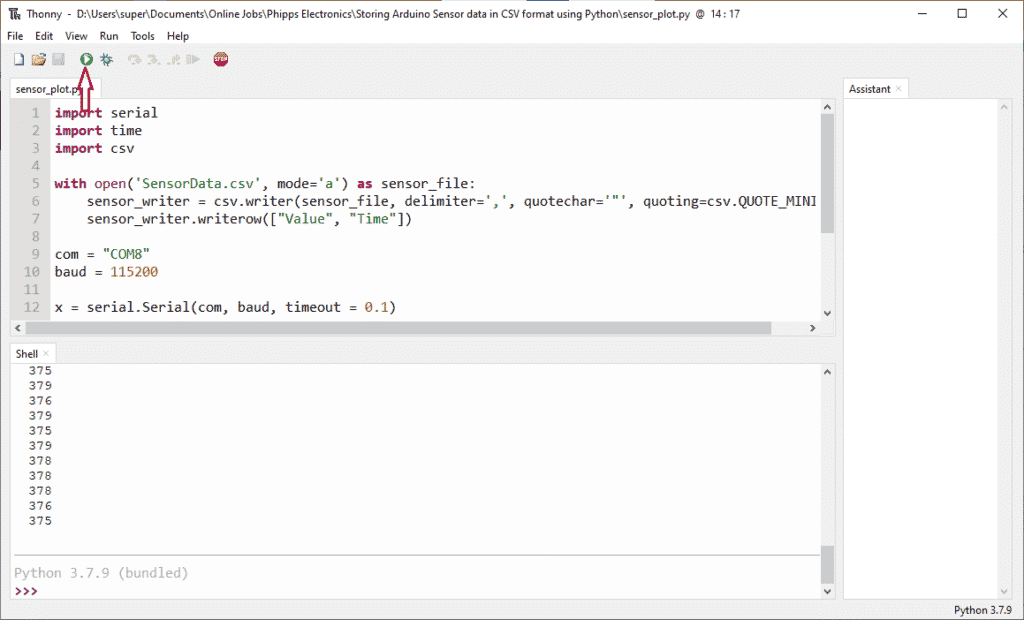
import serial
import time
import csv
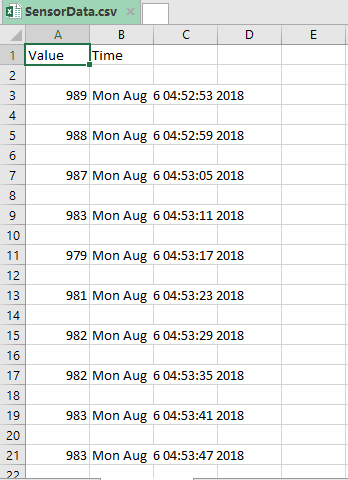
with open('SensorData.csv', mode='a') as sensor_file:
sensor_writer = csv.writer(sensor_file, delimiter=',', quotechar='"', quoting=csv.QUOTE_MINIMAL)
sensor_writer.writerow(["Value", "Time"])
com = "COM8"
baud = 115200
x = serial.Serial(com, baud, timeout = 0.1)
while x.isOpen() == True:
data = str(x.readline().decode('utf-8')).rstrip()
if data is not '':
print(data)
with open('SensorData.csv', mode='a') as sensor_file:
sensor_writer = csv.writer(sensor_file, delimiter=',', quotechar='"', quoting=csv.QUOTE_MINIMAL)
sensor_writer.writerow([int(data), str(time.asctime())])